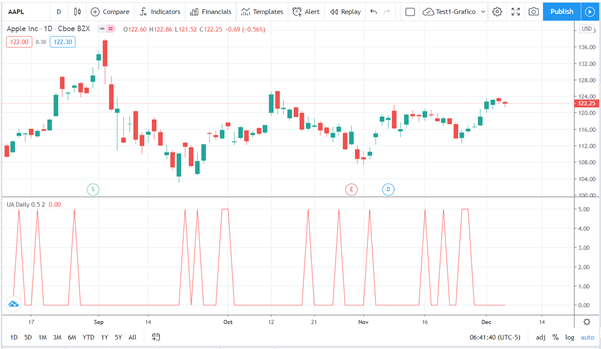
In this post we want to share one of the indicators we have developed to analyze price behavior. Daily timeframe is preferred in this case because once the entry set-up is identified and Take-profit and Stops are set, you don’t need to stay in front of the monitor all-day long to look at indicators or other signals.
The idea being explored with this indicator is very simple:
- Check opportunity to OPEN a position when market open
- CLOSE the position when the Take profit is reached or the Stop is hit.
We use this set of conditions:
- Close > Close[1]
- Daily close % variation > Threshold 1 (0.5%)
- Daily close % variation < Threshold 2 (2%)
- (Close[2] < Open[2]) or (Close[3] > Close[2])
As you can see conditions are very simple and basically aims at identifying stocks that are in positive trend; the picture below show an example on $AAPL stock, you can see that the pattern happens quite frequently.

To perform backtesting on this indicator, the following conditions have been added:
- Take profit: 1%
- Stop loss: 10% (due to this market volatility)
- If a position is still open after 4 days -> we close the position
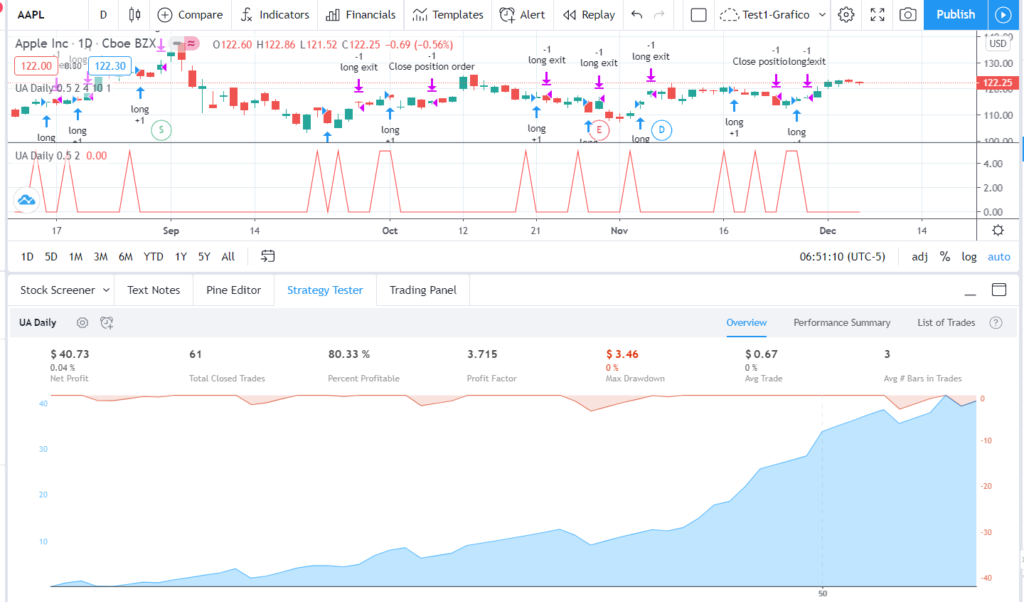
Below picture summarize the backtesting results.

As you can see backtesting show good equity line shape, confirming the interesting approach provided by the indicator.
Hope you liked this post, leave comment below for questions and don’t forget to support us by subscribing our Youtube channel https://bit.ly/3mPVYt9